
The engagement rate for a Facebook Page is often used as a benchmark for performance against competitors and similar pages. It isn’t however so cut and dry.
Here is how socialbakers determines Engagement Rate:
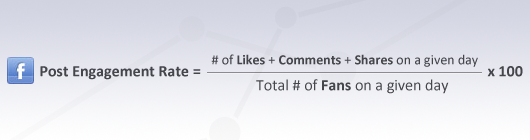
Facebook does not show a percentage for engagement rate, instead they focus on absolute numbers for Post Clicks and Comments, Likes and Shares.
There are issues with both approaches. For the Socialbakers formula, it doesn’t take into account the fact that people do click links and go to a website where they can in fact learn more about the brand. This is more of a technological limitation, given that they have access to those figures.
Both formulas for engagement don’t take into account the different reach of a facebook post. From experience, we know that facebook shows a Page’s updates to around 30% of the total number of people who have subscribed to its updates, and this percentage is influenced by sponsored posts and other ad formats facebook offers.
Now imagine that every once in a while you sponsored a post aimed at people who subscribed to your page, in fact countering the edge rank algorithm. The obvious conclusion is that your engagement rate will rise, no matter which formula you use.
For me this is a symptom of a bigger issue, that the overall average of engagement rate will be in correlation with the overall advertising investment of brands in facebook. So if you’re benchmarking your presence on Facebook in relation to competitors or even the average of the sector, do use that information with a grain of salt, considering that there is a percentage of investment which is unknown.